The React Developer Tools has been the go to place in the browser to inspect and debug React applications. The good news is that recently it got even better!
With the release of Devtools v4, the inspection powers we as developers have at our fingertips have increased in leaps and bounds. Let’s have a quick look at some of the highlight in the new and shiny Devtools!
Table of contents
We already notice the the first change when we open the browser’s development console. Where previously we could find the Devtools under the React tab, there are now two brand new tabs instead: Components and Profiler.

Under Components we find everything we need to inspect our component tree and under Profiler resides tools to check and inspect the performance of our applications.

Free eBook
Directives, simple right? Wrong! On the outside they look simple, but even skilled Angular devs haven’t grasped every concept in this eBook.
-
 Observables and Async Pipe
 -
 Identity Checking and Performance
 -
 Web Components <ng-template> syntax
 -
 <ng-container> and Observable Composition
 -
 Advanced Rendering Patterns
 -
 Setters and Getters for Styles and Class Bindings
Great news is that a lot of work has gone into speeding up the performance of the Devtools so it will perform well even in large applications.
The Components tab
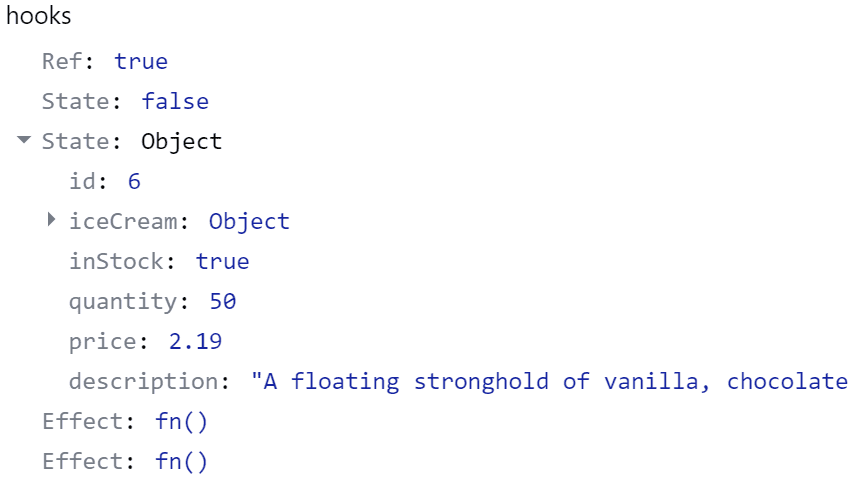
Fellow Hooks enthusiasts will rejoice that the support for Hooks has seen a major improvement. Hooks now enjoy the same level of support as props and state.

The ability to inspect our Hooks adds a much needed layer to the debugging of our newest React applications.
A lot of work has gone into making it even easier to find the components we are debugging, which components they are related to, the elements they render in the browser’s DOM and their source code in the source map.
For example, it is possible to zoom in on a component to see its owner’s tree showing the child components rendered by it.

Or alternatively, we can see the list of owner components that rendered our component!

The Profiler tab
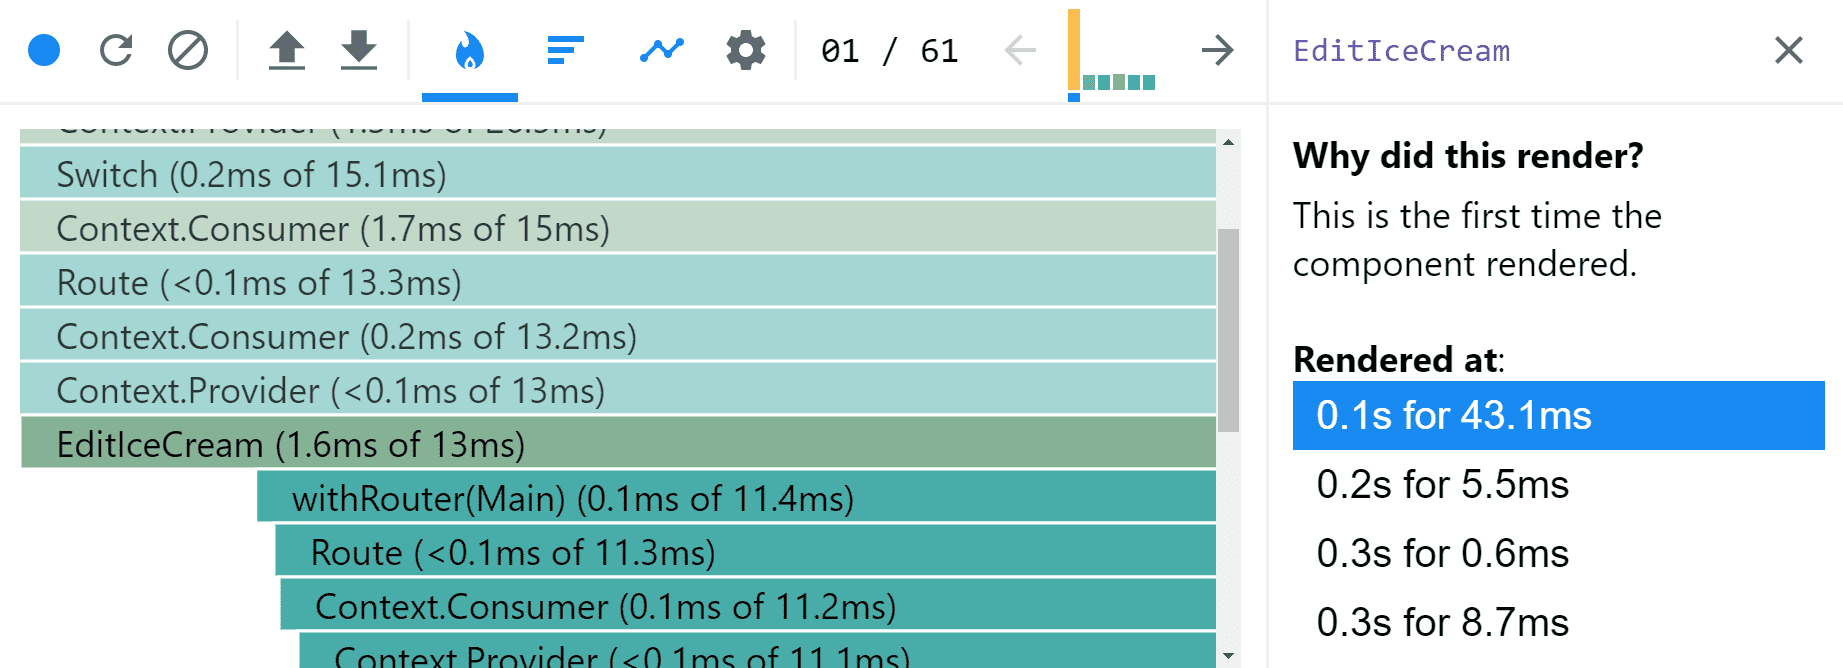
The Profiler tab is all about our app’s performance. It shows us how long components take to render so that we can find bottlenecks in our applications.
An important update to the new Devtools is the ability to capture the first render cycle of components when the application bootstraps.
When we record a profiling session we get a flame graph showing the render sequences and times of all the components in our application.
In the Devtools v4 we can even see a list of all the render times of our components and, if we turn the option on, the reason that any specific render was triggered!

These are only a few highlights of the new features waiting inside the new React Devtools!
To get the lowdown on everything new head to the changelog for version 4 or you can try out all the new features for real in the Devtools demo environment!
And if you are wondering what the deal is with all the ice creams in the examples, come check out what it is all about in the new React course I am working on.


