What is data visualization? In a nutshell, it’s just a presentation of data in a graphical format. Using charts or graphs to visualize large amounts of complex data is easier for a human brain to understand. It helps us to see exactly what we need from our dataset and quickly process the required information.
One of the most popular libraries for data visualizations in JavaScript is D3.js. As stated in the D3 overview, it’s combining powerful visualization components and a data-driven approach to DOM manipulation. In other words, it’s similar to how jQuery works with the DOM. But what if we want to use a JS framework like Vue.js to build a data visualization? Vue has its own approach to DOM manipulation, would it collide with D3 way of doing things?
Let’s try to build a simple visualization to see how these tools work together.
Table of contents
What are we going to build?
In the first part, we will build a simple application to generate a star-shaped graph and change it dynamically using Vue.js framework.
If you want just to check the source code, it’s here.
Scaffolding the project
We’re going to use the Vue CLI to scaffold our project. You will need Vue CLI installed, if you don’t have it, please run:
npm install -g @vue/cli
# OR
yarn global add @vue/cli
Now we’re ready to create a new Vue application. We can do it by running the following command in the terminal:
vue create my-d3-app
You will be prompted with the list of options. For now, we can go with the Default setup.
Now you can open your application in the code editor and run serve command in the root of the project to see your it in the browser.

Let’s delete all the content from components/HelloWorld.vue and rename it into Chart.vue - we’re going to place our chart here.
We need also to edit our App.vue file to include our chart there: remove the logo and rename an imported component into Chart as well:
<!-- App.vue -->

<template>
  <main>
    <Chart />
  </main>
</template>

<script>
  import Chart from './components/Chart.vue';
  export default {
    name: 'app',
    components: {
      Chart,
    },
  };
</script>
The only thing left is to install D3.js as a dependency via npm:
npm install d3
# OR
yarn add d3
Now we’re ready to work on our chart!
Starting with SVG
To draw our star, we will use an SVG. So the first thing to add to our Chart component template is actually a <svg> tag with a width and height of 500px:
<!-- Chart.vue -->

<template>
  <section>
    <svg width="500" height="500"></svg>
  </section>
</template>
Free eBook
Directives, simple right? Wrong! On the outside they look simple, but even skilled Angular devs haven’t grasped every concept in this eBook.
-
 Observables and Async Pipe
 - Identity Checking and Performance
- Web Components <ng-template> syntax
- <ng-container> and Observable Composition
- Advanced Rendering Patterns
- Setters and Getters for Styles and Class Bindings
To test our SVG, let’s draw a simple circle there. We can do it with the circle tag with four attributes:
- X-coordinate of the circle center;
- Y-coordinate of the circle center;
- circle radius;
- color to fill the circle.
<svg width="500" height="500">
  <circle cx="60" cy="60" r="50" fill="red" />
</svg>
Currently, our SVG looks like this:

But it’s still the pure SVG without any kind of D3 magic. Let’s fix this with transforming our circle into a star-shaped figure!
Some math behind the star
So, what do we need to draw a star in terms of geometry? First of all, a star is a radial shape. It means that star is based on a circle and can be created with only two attributes: an angle and a radius. As for radius, it’s easy to see that we will need two radiuses here: for outer and inner circles.
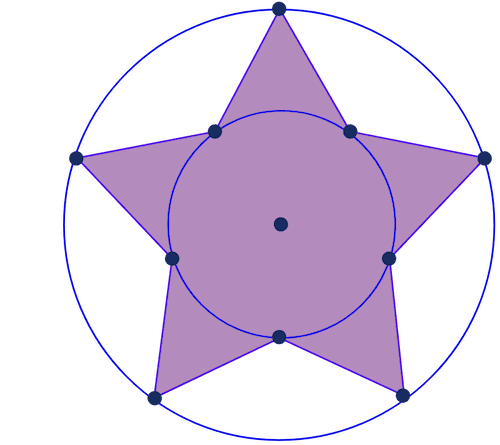
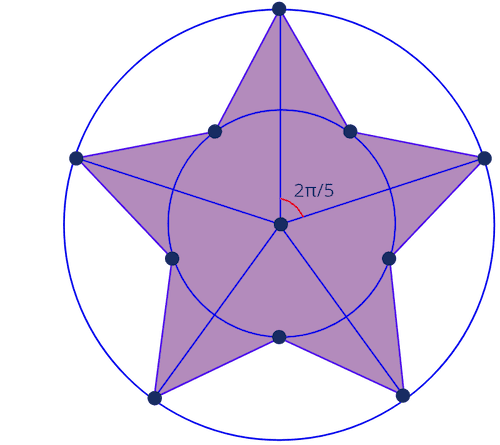
What about angles? Let’s connect the circle center with star rays edges and take a look.

So, if the star has n rays (in our case n = 5), what should be an angle between these rays? As you can see, we’re dividing the circle into 5 equal parts like we would cut a pie on five equal pieces. The circle length is 2π; so the angle is 2π / n (or, in our case 2π / 5)
What about points on the inner circle? We need them as well to draw the star correctly. Every point on the inner circle is placed right in the middle between two points on the outer circle. So, the angle between inner and outer points is 2π / 2n (or in our case 2π / 10)
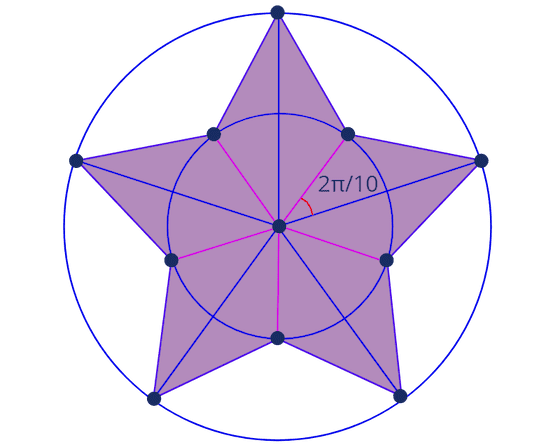
So what is the path for drawing a star? First, we draw the point on an outer circle; then we move for 2π / 10 and draw a point on the inner circle; one more 2π / 10 step and a point on the outer circle, etc.
Let’s try to implement this with D3!
Using D3 lineRadial method to generate the SVG path
First, let’s define our outer radius and a number of rays and place them in Vue component data:
<!-- Chart.vue -->

<template>
  ...
</template>

<script>
  export default {
    data() {
      return {
        outerRadius: 200,
        rays: 5,
      };
    },
  };
</script>
We’re going to set an inner radius to equal 50% of the outer one:
<script>
  export default {
    data() {
      ...
    },
    computed: {
      innerRadius() {
        return this.outerRadius * 0.5
      }
    }
  }
</script>
Now let’s create an array of points to draw the star. We’re going to use the algorithm described in the previous section. First, let’s specify the angle step between two neighbor points:
computed: {
  innerRadius() {
    return this.outerRadius * 0.5
  },
  radialPoints() {
    const step = 2 * Math.PI / (this.rays * 2)
  }
}
Then, we need to create an empty array for points and a for loop to fill it:
radialPoints() {
  const step = 2 * Math.PI / (this.rays * 2)
  const points = [];
  for (let i = 0; i <= this.rays * 2; i++) {
  }
}
As you can see, we will generate a new element of points array for every point on the inner and outer circles, and we have rays * 2 points. For every point, we also need a radius to define if the point lies on the inner circle or the outer one. It’s easy: let’s have every even point on the inner circle and every odd one on the outer circle:
radialPoints() {
  const step = 2 * Math.PI / (this.rays * 2)
  const points = [];
  for (let i = 0; i <= this.rays * 2; i++) {
    const currentRadius = i % 2 ? this.innerRadius : this.outerRadius;
  }
}
Then, we can push a new point to points array and return this array from the computed property:
radialPoints() {
  const step = 2 * Math.PI / (this.rays * 2)
  const points = [];
  for (let i = 0; i <= this.rays * 2; i++) {
    const currentRadius = i % 2 ? this.innerRadius : this.outerRadius;
    points.push([i * step, currentRadius])
  }
  return points;
}
As a result, we will have this array:
[
  [0,300],
  [0.6283185307179586,150],
  [1.2566370614359172,300],
  [1.8849555921538759,150],
  [2.5132741228718345,300],
  [3.141592653589793,150],
  [3.7699111843077517,300],
  [4.39822971502571,150],
  [5.026548245743669,300],
  [5.654866776461628,150],
  [6.283185307179586,300]
]
where first value is an angle from zero-point and second value is a radius.
Now we need somehow to draw this array on our SVG. For this, we need to generate an SVG path and that’s why we need D3 library. It has plenty of magic methods to ‘translate’ different kinds of math calculations to the actual SVG properties.
Right now we need a lineRadial method that takes an array of radial points and produces the SVG path to draw. But first we need to import this method to our Vue component:
<script>
  import { lineRadial } from 'd3-shape';

  export default {
    data() {
      ...
    },
    computed: {
      ...
    }
  }
</script>
And now we can create a computed property to calculate the radial data for SVG path:
radialData() {
  const radialLineGenerator = lineRadial();
  return radialLineGenerator(this.radialPoints);
}
Hooray! The only thing left is to draw this data using the SVG path component. Let’s replace our circle with it:
<template>
  <svg width="500" height="500">
    <path
      class="radial"
      :d="radialData"
      transform="translate(250, 250)"
      fill="green"
    ></path>
  </svg>
</template>
We used transform here to move the center of the star to the 250, 250 coordinate so it’s centered on our SVG background. And now we have a green star!

Customizing star rays amount with Vue
What if we want to change the number of rays? Usually, D3.js manipulates DOM in jQuery-way: you would need to select an SVG and to change it’s path element with new data. But with Vue framework, we don’t need this! We can simply change our data properties and Vue will care about re-render process automatically.
Let’s try to change rays property:
data() {
  return {
    outerRadius: 200,
    rays: 8
  }
},
…and you can see the star changed immediately!

Can we make this process more interactive? Why not! Let’s add a range input to our Vue component right below the </svg> closing tag:
<section>
  <svg width="500" height="500">
    ...
  </svg>

    Rays


</section>
We want to limit our star to have 4 rays at minimum and 60 at maximum. Now we can bind this input to Vue rays property with v-model directive:
<input name="rays" type="range" min="4" max="60" v-model="rays" />
That’s it! Now when we change rays amount via input, Vue will re-render the star:
What’s next?
In the next article, we’re going to learn how to scale our data with D3 and how to create our own scales. We will add more properties to our star to look like this: