You can find the first part of this article here.
If you skipped part 1, here is the code to start with 😉
Table of contents
What are we going to build?
In this article, we will improve our star example with D3 data scaling. Scale functions are JavaScript functions that:
- take an input (usually a number, date or category) and
- return a value (such as a coordinate, a color, a length or a radius).
Free eBook
Directives, simple right? Wrong! On the outside they look simple, but even skilled Angular devs haven’t grasped every concept in this eBook.
-
 Observables and Async Pipe
 - Identity Checking and Performance
- Web Components <ng-template> syntax
- <ng-container> and Observable Composition
- Advanced Rendering Patterns
- Setters and Getters for Styles and Class Bindings
They’re typically used to transform (or map) data values into visual variables (such as position, length, and color). This way, we can quickly ‘draw’ any set of initial data as SVG.
So, we will map our star ‘visuals’ to specific data values. At the end of the article, our star will look this way:
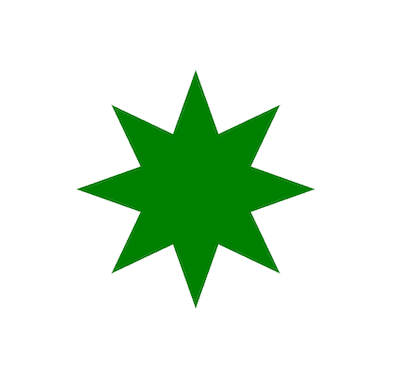
Scaling star radius
The first obvious question is: why do we need to scale the radius? Can’t we use the value without scaling, as we did for rays in the previous article?
The reason is we want to limit our star outer radius while input data value can vary in a vast range. D3 will calculate the ratio and scale our star radius proportionally.
For the first iteration, let’s say our input value will scale from 10 to 1000, but we want to display a star with a max radius of 250px. To perform the calculation, we’re going to use D3 scaleLinear method.
scaleLinearconstructs a new continuous scale with the specified domain and range. Each range value y can be expressed as a function of the domain value x: y = mx + b. (D3 Wiki)
First, let’s remove our hardcoded outerRadius from data and let’s create a new computed property to calculate it. Instead, we will add a radius property to data; it will serve as our input value.
data() {
  return {
    radius: 300,
    rays: 8,
  };
},
computed: {
  outerRadius() {
    return this.radius
  },
  ...
},
So, for now outerRadius just returns what we put in radius. Now, let’s add some scaling to it! First, we need to import scaleLinear method from D3:
import { lineRadial } from 'd3-shape';
import { scaleLinear } from 'd3-scale';
We need to define a scaling function using scaleLinear method and then we need to call this function with our input radius as a parameter:
computed: {
  outerRadius() {
    const scale = scaleLinear()
      .domain([10, 1000])
      .range([5, 250]);

    return this.radius
  },
  ...
},
What’s happening here? We provided a domain to scaleLinear, and it’s the range in which our input value is going to change. As for range, it’s what we have as an output: we expect our outerRadius to change in the range between 5px and 250px.
Now we can pass radius to the scale function:
computed: {
  outerRadius() {
  const scale = scaleLinear()
    .domain([10, 1000])
    .range([5, 250]);

  return scale(this.radius)
  },
  ...
},
As a result, we will have something like this:
Try to change the radius property to 500 or 1000, and you will see how the star grows in size.
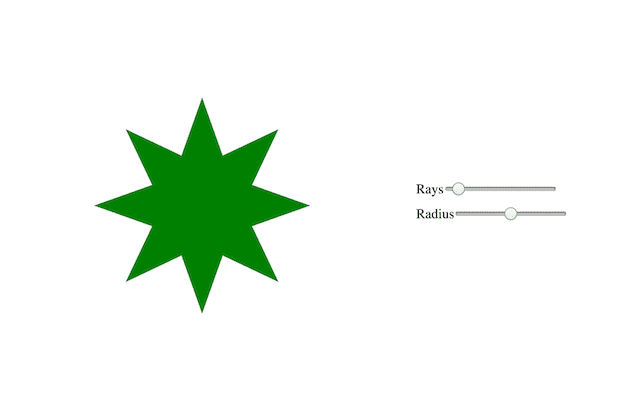
Now, similarly to rays, let’s add an input to change star radius dynamically. In our template, let’s add
<div class="range-input">
  <label for="radius">Radius</label>
</div>
This way, we have bound our radius data property to the input field value.
Styling the app
Now we can change star radius and rays amount, but it still keeps this dull green color. What if we can improve it? If our star were a real star, it would change its color proportionally to its temperature, from red to blue. Can we create a scale that will do the same? With D3, the answer is obvious 😊.
But before we start working on it, let’s style our application a bit. First, let’s move sliders to the right side of our image. To do so, we need to change the template slightly:
<template>
  <section class="wrapper">
    <svg width="500" height="500">
      <path
        class="radial"
        :d="radialData"
        transform="translate(250, 250)"
        fill="green"></path>
    </svg>
    <aside>
      <div class="range-input">
        <label for="radius">Radius</label>
      </div>
      <div class="range-input">
        <label for="radius">Radius</label>
      </div>
    </aside>
  </section>
</template>
And let’s add some styles to the style section:
<style lang="scss">
  .wrapper {
    display: flex;
    align-items: center;
  }
  aside {
    padding-left: 20px;

    .range-input {
      display: flex;
      align-items: center;
      margin-bottom: 10px;

      input {
        margin-right: 10px;
      }
    }
  }
</style>
Now our app looks more structured:
Also, we want our star to be lighter, like… well, like real stars! Let’s give it a dark background with a deep blue rectangle and let’s change star color to white for now.
<svg width="500" height="500">
  <rect width="100%" height="100%" fill="#0e0432" />
  <path
    class="radial"
    :d="radialData"
    transform="translate(250, 250)"
    fill="white"
  ></path>
</svg>
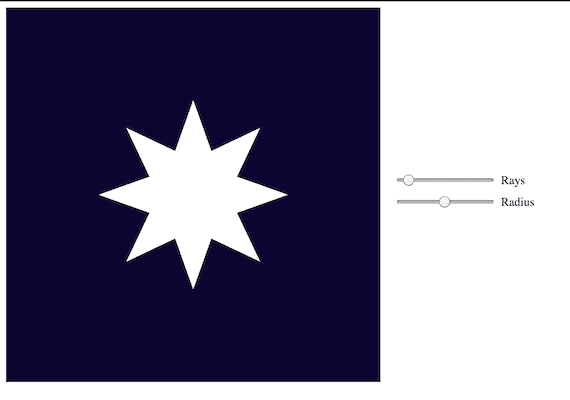
Now we can play with changing star color!
Creating a custom scale for star color
While D3 has built-in color interpolators, we want to build our simple one. We will take an input value from 0 to 100, and we will define a color for 0, 25, 50, 75 and 100 marks. D3 is smart enough to interpolate the color for in-between values.
As a first step, let’s create a new data property - heat and set it to be 5:
data() {
  return {
    radius: 300,
    rays: 8,
    heat: 5,
  };
},
Next, let’s create a new computed property for star color calculation:
starColor() {
  return this.heat
},
And finally we’re ready to create a new scale:
starColor() {
  const myColor = scaleLinear()
    .domain([0, 25, 50, 75, 100])
    .range(['#ff7665', '#ffb469', '#ffe876', '#fff', '#99cdff']);
  return myColor(this.heat);
},
Now, we have a star color ready to be added to our SVG path fill property instead of static white color. Let’s create a dynamic binding there:
<path
  class="radial"
  :d="radialData"
  transform="translate(250, 250)"
  :fill="starColor"
></path>
Our star has changed the color!
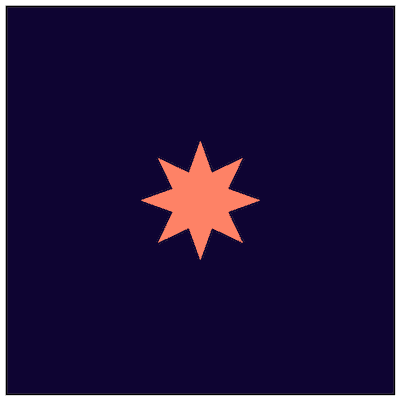
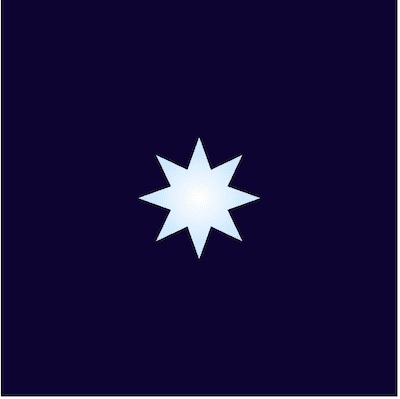
Let’s try to change the heat data property to 90, and a star will become light blue. To make it look nicer, we can create a gradient from white to current star color:
<svg width="500" height="500">
  <defs>
    <radialGradient id="starGradient">
      <stop offset="2%" stop-color="white" />
      <stop offset="95%" :stop-color="starColor" />
    </radialGradient>
  </defs>
  ...
</svg>
And now we can fill our star with this gradient instead of solid color:
<svg width="500" height="500">
  <defs>
    <radialGradient id="starGradient">
      <stop offset="2%" stop-color="white" />
      <stop offset="95%" :stop-color="starColor" />
    </radialGradient>
  </defs>
  <rect width="100%" height="100%" fill="#0e0432" />
  <path
    class="radial"
    :d="radialData"
    transform="translate(250, 250)"
    fill="url(#starGradient)"
  ></path>
</svg>
Now our star is really nice-looking:
And the last thing left is to add the same input slider as we did previously for rays and radius:
<div class="range-input">
  <label for="heat">Heat</label>
</div>
And we’re ready to go! You can find the final code of the Chart component here.
What’s next?
In part 3, we’re going to create not a single star but the whole constellation! And we will visualize a real dataset of Vue repositories: